| Also featuring photos from our monthly supplement... | |
Plan ahead for events
|


It's not too late
to pick up the August 25th print edition of The Oakwood Register with a special pull-out section:
Arts, Etc... 435 Patterson Road |

Smith Gardens celebrates 35 years
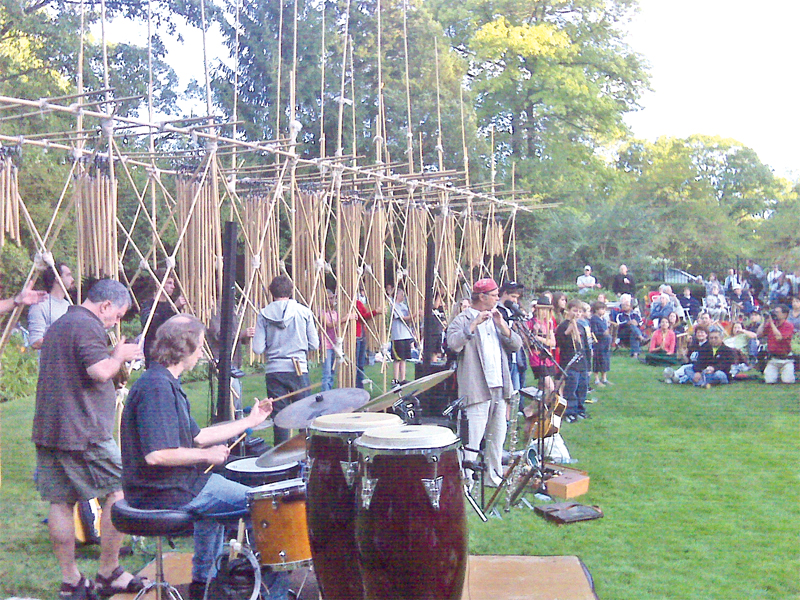 Photo by Dee Dee Huffer
The city of Oakwood celebrated the 35th anniversary of Smith Gardens on Sunday with a memeorable Blanket Concert by the musical group Puzzle of Light. Also on the bill was a special performance by youngsters from the Oakwood community on a custom-built sound sculpture made by them earlier in the month with the help of artist, musician and Puzzle of Light leader Michael Bashaw. Other percussion and musical instruments were also handed out to the attendees to accompany the performance.
Oakwood schools earn 2nd Last year, the Ohio Department of Education added a new, highest ranking in its system of classifying schools and districts: “Excellent with Distinction.” For the second year, Oakwood City School District has earned this top honor. Ohio districts are judged on four main measures on their Local Report Card issued by the Ohio Department of Education: indicators (test pass rates, attendance, and graduation rate), performance index (weighted measure of how well students do on state tests), Adequate Yearly Progress (AYP) (measure of how well demographic subgroups do on tests), and Value Added (measure of student growth from one year to the next). With the exception of attendance and graduation rates, all four measures of success are based on 2-hour, content-based state standardized tests that students take in grades 3-8 and 10 in the spring of each year. A Closer Look at Report Card Measures Currently, there are 30 indicators that a district can meet, 28 of which are based on pass rates on the state tests that students take; the other two include student attendance and graduation rate. Consistently Oakwood meets all state indicators. Performance index is calculated by weighting the percent of tests that score in each of the 5 achievement levels: advanced = 1.2; accelerated = 1.1; proficient = 1.0; basic = 0.4; limited = 0.2. As such, if all students earned the “advanced” level on each of the tests that they take, the performance index would be 120 (highest score possible). Our current performance index score of 108.7 represents an average test score above the proficient level. This year’s performance index is up slightly over last year’s of index of 107.8. AYP looks at the degree to which schools and districts are adequately serving subgroups of students, including Economically Disadvantaged students, Limited English Proficient students, Students with Disabilities, and students of various racial categories. Because Oakwood is small and mostly demographically homogeneous, other than the racial category “White Students,” the only AYP subgroup with enough students to be calculated is Students with Disabilities. This year, as in past years, the number of our Students with Disabilities who passed their state tests met the AYP requirement. The federally mandated, required pass rates for AYP increase regularly and will continue to do so until the 2013-2014 school year when a 100 percent pass rate is required to meet AYP (100 percent of students must pass 100 percent of their state tests). As a result, each year the State of Ohio tweaks AYP. There are currently several different means by which a school/district can meet AYP (including straight pass rate, two-year average, value added growth projection, etc.). The final measure of a school’s/district’s success, Value Added, measures student growth or progress from one year to the next by calculating the average change in each student’s placement on a normal curve of all testers in the state, by grade and content area. Value Added looks at how students perform longitudinally and attempts to determine the extent to which school and districts “add value” to a student’s learning by helping the student to make at least “one year’s worth of growth” each academic year. Schools and districts are rated as not meeting, meeting, or exceeding expected growth. This is the third year of these ratings, and each year Oakwood has exceeded expected growth. Once a school/district has exceeded expected growth for two consecutive years, it moves up one level in the state’s classification system (Excellent, Effective, Continuous Improvement, Academic Watch, and Academic Emergency). Thus the state last year had to add a new, higher level above the previous highest level of “Excellent” for those schools/districts, like Oakwood, which exceeded expected growth for at least two consecutive years. As such, last year Oakwood moved up from “Excellent” to “Excellent with Distinction” and then retained that rating this year. Value added also helps stakeholders to compare the performance of various schools to one another. In the past, people lamented that it was difficult to compare the effectiveness of schools by merely looking at student pass rates on tests because of the difference in student populations from school to school. Because value added compares students’ progress against their previous performance, it allows a truer “apples to apples” comparison. For example, frequently - but certainly not always - Harman Elementary has slightly higher pass rates than Smith Elementary. This might make one wonder if the students of Harman are being better served than the students at Smith. According to our value added data, this is not the case. When one looks at their value added scores, students in both schools have exceeded their expected growth. In other words, students at both schools made greater gains over their previous performance than expected (using the normal curve-based algorithm used by the state for these calculations). Value added has been indispensable in providing stakeholders with a more accurate way to compare the performance of one school to that of another. Oakwood’s Local Report card can be found at http://www2.oakwood.k12.oh.us/~cia/CIA/Accountability.html If you have questions, please feel free to contact me at 297-7801.
|
![]()
September 1, 2009
Volume 18, No. 35
front page
arts
schools
sports
editorial
'round town
people
events
obituaries
|
Weddings... Congressman meets with Oakwood Liberty Group Varsity & alumni duffers at DCC Historian to lecture on Hills & Dales Sept. 28 St. Paul's to hold "Mass on the Grass" Aug.30 Noble Circle Project fall program to begin At the Wright Library... September Calendar Golf fundraiser to fight MS Oct. 4 Burt Saidel... Womens' photography exhibition opens at UD Sam Andrews Hall of Honor luncheon Sept. 17
|